Comments

Comments:
Alex Tappen
Jacob Cohen
Matt Graeff

Wednesday, February 25, 2015

Blog Post 6: Matchweek 26

Player of the week:

Branislav Ivanovic (Full-back, Chelsea)

For a second straight matchweek, I have named a member of league-leading Chelsea a player of the week. Ivanovic has been one of Chelsea's most dependable players so far this year, having not missed one minute of this year's Premier League campaign. This week, he played the full 90 against a struggling Burnley side at the Bridge. Like his fellow Serb and Chelsea teammate, Nemanja Matic, Ivanovic also plays a position that doesn't show up on the scoresheet too often. However, it is what Ivanovic is doing so well getting forward, whist still tracking back on defense that makes him such a great player.


The responsibilities of a full-back are both offensive and defensive. Offensively, full-backs can provide width and service into the box. Defensively, full-backs are responsible for preventing attacks down their flank. Overall, the responsibility of a full-back is to control their wing of the pitch.

These are the statistics that I feel show how the responsibilities of a full-back are fulfilled (Ivanovic v Burnley):
  • Tackles (1)
  • Interceptions (0)
  • Fouls (0)
  • Pass completion percentage (82.1%)
  • Assists (0)
  • Dribbles (2)
  • Dispossessions (3)
  • Unsuccussful touches (2)
  • Key passes-passes that lead to a scoring opportunity (2)
  • Passes (39)
  • Shots on target (1)
  • Shots (3)
  • Goals (1)

Before turning all of these stats into percentages, I decided to sort them into three different categories: defense, build-up, offense. I decided to do this to make it easier to group the statistics and turn them into percentages so they can go into the formula. Here is how the categories line up for this position's statistics:
Defense: tackles, interceptions, fouls
Build-up: pass completion percentage, dribbles, dispossessions, unsuccessful touches
Offense: passes, key passes, assists, shots, shots on target, goals

The statistics I will put into the formula are (weight in the rating):
  • Tackles + interceptions / foul: 100% (35%)
  • Pass completion percentage: 82.1% (30%)
  • Dispossessions + unsuccessful touches / dribble: 250% (15%)
  • Key passes(x2.5) + assists(x5) / pass: 12.82% (10%)
  • Shots on target + goals(x5) / shot: 200% (10%)
Step-by-Step:
  1. 100 X 0.35 = 35
  2. 82.1 X 0.3 = 24.63
  3. 250 X 0.15 = 37.5
  4. 12.82 X 0.1 = 1.28
  5. 200 X 0.1 = 20
  6. 35 + 24.63 + 37.5 + 1.28 + 20 = 118.41
  7. 118.41 ÷ 14 = 7.89
As it turns out, my hypothesis that the number to divide the sum of all percentages, after they were weighted, is one less than the original number of statistics was proven to be untrue. Chelsea v Burnley was one of the games I watched this week, and I believe Ivanovic's rating should have been between 7 and 8.5. The high number that the sum of all the weighted percentages provided allowed for a lot of options to divide it by, and I felt 14 gave Ivonovic the appropriate rating.

Ivanovic's Rating: 7.89


To verify:

Benjamin Mee (Full-back, Burnley)

To be sure my full-back formula is accurate, I decided to test it on Benjamin Mee, another goal-scoring full-back, who played against Chelsea this week. I estimate his rating should be between 6.5 and 8.

Mee celebrates on the right
  • Tackles + interceptions / foul: 0% (35%)
  • Pass completion percentage: 64.7% (30%)
  • Dispossessions + unsuccessful touches / dribble: 100% (15%)
  • Key passes(x2.5) + assists(x5) / pass: 7.35% (10%)
  • Shots on target + goals(x5) / shot: 600% (10%)
Step-by-Step:
  1. 0 X 0.35 = 0
  2. 64.7 X 0.3 = 19.41
  3. 100 X 0.15 = 15
  4. 7.35 X 0.1 = 0.74
  5. 600 X 0.1 = 60
  6. 0 + 19.41 + 15 + 0.74 + 60 = 95.15
  7. 95.15 ÷ 14 = 6.80

Mee's Rating: 6.80


Success!

Friday, February 13, 2015

Blog Post 5: Matchweek 25

Premier League Matchweek 25 is finally upon us! This is the schedule: 

The matches I watched this week were Liverpool v Tottenham and Chelsea v Everton. I watched highlights of the rest of the matches.

Player of the week:

Nemanja Matic (Defensive Midfielder, Chelsea)


This week, Matic played the full 90 for Chelsea as they faced an Everton side struggling to get points in the Premier League. It is not often that Matic's name pops up on the score sheet, and this week that trend continued. However, Matic's contribution to his team is still massive.
As someone who plays the role of defensive midfielder on Jose Mourinho's side, Matic has a lot of responsibility. The overall general responsibilities of a DM are to prevent quick counter attacks and to connect the defense to the offense. Fulfilling these responsibilities includes tasks such as making tackles and interceptions as well as making forward passes and dribbles, all with minimal mistakes made in the process.
To formulate how Matic fulfilled all of these responsibilities in the match against Everton, I now need to select some important statistics that represent how these responsibilities were fulfilled.

What I chose (Matic v Everton):
  • Tackles (1)
  • Interceptions (2)
  • Fouls (1)
  • Pass completion percentage (89.8%)
  • Percentage of shots on target (33.3%)
  • Dribbles (7)
  • Dispossessions (2)
  • Unsuccessful touches (1)
Most of these stats are coming from the incredible WhoScored.
Now, my task is to put all of these statistics into a formula to rate Matic's performance against Everton on a scale from 1-10. As I watched this game, I know that Matic played well and I feel his rating should be in the range of 7.5-9.
To put all of these statistics into a formula, I need to turn them all into percentages so they are all the same unit. To do so for tackles, interceptions, and fouls, I am making them into a ratio that is fouls per tackle + interception (33.3%). To do so for dribbles, dispossessions, and unsuccessful touches, I am making them into a ratio that is dispossessions + unsuccessful touches per dribble (42.9%).
The final step in the creation of this formula is creating a scale that accurately weighs each of the importance of each statistic.

The order of the importance of each percentage is (from least important to most important): percentage of shots on target (33.3%), dispossessions + unsuccessful touches per dribble (42.9%), fouls per tackle + interception (33.3%), pass completion percentage (89.8%).
The weight of each statistic in the formula is:
  • Percentage of shots on target (33.3%): 5%
  • Dispossessions + unsuccessful touches per dribble (42.9%): 25%
  • Fouls per tackle + interception (33.3%): 30%
  • Pass completion percentage (89.8%): 40%
Here is a step by step of how I calculated each number:
  1. 33.3 X 0.05 = 1.665
  2. 42.9 X 0.25 = 10.725
  3. 33.3 X 0.3 = 9.99
  4. 89.8 X 0.4 = 35.92
  5. 1.665 + 10.725 + 9.99 +35.92 = 58.3
  6. 58.3 ÷ 7 = 8.33
I decided to divide the sum of each statistic by 7 because that is the number that worked best to convert the statistics into the scale of 1-10. I feel like 7 was likely the number that worked best because it is 1 less than the original number of statistics that I used before I combined some and turned them into percentages. I will definitely test this hypothesis on formulas for other positions.

Matic's Rating: 8.33


To test this formula, I used another Premier League defensive midfielder, Francis Coquelin of Arsenal. Having watched him play live, I feel his rating should be in the range of 7-8.5.


  • Percentage of shots on target (0%): 5%
  • Dispossessions + unsuccessful touches per dribble (33.3%): 25%
  • Fouls per tackle + interception (33.3%): 30%
  • Pass completion percentage (82%): 40%
Here is a step by step of how I calculated each number:
  1. 0 X 0.05 = 0
  2. 33.3 X 0.25 = 8.325
  3. 33.3 X 0.3 = 9.99
  4. 82 X 0.4 = 32.8
  5. 0 + 8.325 + 9.99 +32.8 = 51.115
  6. 51.115 ÷ 7 = 7.3

Coquelin's Rating: 7.3


It seems I have found success in my defensive midfielder rating formula! After many trials, it finally works! The experience of creating this defensive midfielder rating system should help the rest of the process go a lot quicker and smoother. I can't wait to see how the other positions turn out!

Wednesday, February 11, 2015

Blog Post 4: Slight Change of Plans

Originally, my plan was to begin my player rating system for Matchweek 25, which I still plan to do, however, a problem that I have encountered is the different formula needed for each different position. I plan to deal with this by rating someone from a different position each matchweek, focusing on anywhere from 1-3 positions per matchweek. Also, as I continue to learn and gain experience, I will still adjust ratings, as I originally planned to.
The positions I will evaluate are the following:
  • Goalkeeper
  • Full-back
  • Center-back
  • Defensive midfielder
  • Attacking midefielder
  • Winger
  • Striker
I feel that doing this will allow for me to adjust my formula better for each different position and lead to more accurate ratings.

Tuesday, February 10, 2015

Blog Post 3: Introduction to Analytics

To begin research on how to put my formula together, I took up a general knowledge of analytics. Analytics can be defined as "the discovery and communication of meaningful data," which could not summarize my approach to this project any better (IBM). Specifically, I feel this definition summarizes my goals best because I want to discover what data is meaningful in soccer and communicate my results, which will be a product of meaningful data, as well as, meaningful data itself.

Below is a video, created by IBM, the international leader in providing data analytics, that generally explains how analytics work. IBM mainly applies their analytics to business, however they briefly mention a few other potential applications. Prepare to learn


As you can see, there are many potential applicable areas for analytics, other than just business. As a personal passion of mine is soccer, that is the area I chose to apply analytics.

Get ready, the formula is coming.

Blog Post 2: WhoScored?


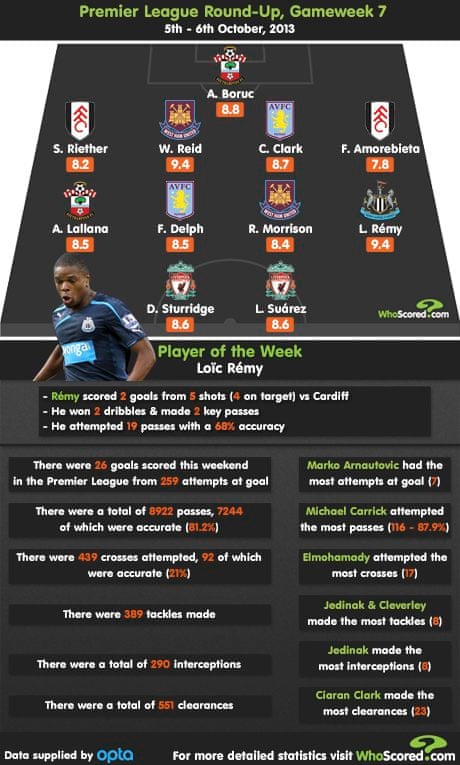
What really inspired my idea to create a system to rate soccer players based on their statistics is WhoScored. They are also a website that rates soccer players based on their statistics. Their cool graphics, teams, and interesting facts that I saw on Twitter led me to follow them and learn all about their player ratings as well. They are very big and continue to gain recognition by the world's best leagues as they can be found all over social media, or on their website or mobile application. There, you can find a break down of many specific statistics about leagues, teams, and individual players that can be filtered by things such as position as well as nationality among many more.


WhoScored is explained here. WhoScored's ratings come as a product of an algorithm that uses over 200 statistics. What they have access to that I do not is a full time data provider (they use Opta) that will be able to put my own algorithm together. This will make things a lot tougher because, at the least, I will have to enter my own data into a calculator that can automatically use my formula. A potential challenge I still face, however, may be having to enter and calculate all data on my own.


I will definitely be using WhoScored as one of my primary resources and I look forward to learning more about soccer and creating my own algorithm and statistics.

Monday, February 9, 2015

Blog Post 1: Proposal


For my genius project, I would like to apply analytics, or the breaking down of statistics, to soccer, the world’s most popular sport. What I would like to do is create my own system to rate players during matches. To do so, I will need to create a formula by combining different statistics that are important to soccer in such a way that it creates an outcome of a number that accurately represents how well a player played during a match on a scale.


My motivation to do this project is first a great personal passion for soccer. If you have not seen me talking about soccer so far this year, I’m really not sure where you’ve been. Also, I want to create a way to tell which individual players are the best. They would all be rated on a standardized scale so they could easily be compared and contrasted.


Here, my timeline shows that this project will last through the next five English Premier League matchdays, or spans of a few days in which every Premier League team plays against one another. For each matchday, I plan to watch at least two full games as well as portions and highlights of all of the rest. This will give me a sense of what is actually happening on the pitch so I can compare it to the outcomes of my formula. During the first matchday of this project, matchday 25, I plan to observe which players have success and try to figure out what contributes to their success and how I can put that into statistics and into my formula. Therefore, I will even create new statistics if I feel what is contributing to players’ success cannot be put into already created statistics. Before matchday 26 starts, I plan to have an initial formula to test for the day’s matches. To test the formula, I plan to pick random players, and compare their rating to how they actually played. For the next few matchdays, through matchday 28, I plan to repeat this process and tweak my formula as needed. For the final matchday, matchday 29, I plan to have finalized my formula and posted all player ratings from the matchday to social media so those who are interested can view, learn, and apply my ratings as they please. The only resource I need is NBC Sports Live Extra, where every Premier League game can be viewed on demand as I won’t be able to watch and analyze multiple live games simultaneously. To show a quick example of a few statistics currently used in soccer, here are the statistics from the FIFA World Cup Final from this summer, where Germany beat Argentina in extra time.


The goal of this project is to create a formula that can accurately rate soccer players based on how well they play during a game. It will be able to show which individual players are best because it will be standardized so players will easily be able to be compared and contrasted. I plan to and I’m excited to invest a lot of time into this, and I hope my formula will actually be able to be used by professional teams one day.